LLDB 정복
종류: Swift
LLDB(Low level Debugger)
- Apple에서의 컴파일러에 필요한 toolchain 개발 프로젝트
- LLVM의 debugger component를 개발하는 서브 프로젝트를 의미
- Low level까지 디버깅 가능
- c, c++, objective c, swift를 제공
Note:💡 신기하게 xcode에서 실행된 프로세스에만 LLDB 콘솔을 쓸 수 있는게 아니라 lldb- n Finder를 입력하면 실행중인 앱의 프로세스에서도 attach해서 사용할 수 있음!(단, csrutil status를 통해 system integrity protection을 disable시켜야 가능!!)
기초 문법
(lldb) command [subcommand] -option "this is argument"
- Command, Subcommand, Option, Argument들로 이루어져 있고, 띄어쓰기로 구분
- Command와 Subcommand
- LLDB 내 Object의 이름 (etc. breakpoint, watchpoint, set, list … )
- 이들은 모두 계층화되어있어, Command에 따라 사용가능한 Subcommand 종류가 다름
- Option
- Command 뒤 어느 곳에든 위치 가능하며,
-으로 시작
- Command 뒤 어느 곳에든 위치 가능하며,
- Argument에 공백이 포함 되는 경우도 있기 때문에,
""로 묶어줄 수 있습니다.
(lldb) breakpoint set --file test.c --line 12
// test.c 파일 내의 12라인에 breakpoint를 set해라는 뜻
Note:💡 대부분의 명령어들과 옵션은 command 맨 앞 1~2개의 알파벳으로 줄여서 사용 가능
(lldb) breakpoint set [option] “arguments”
(lldb) br s [option] “arguments”
Help & Apropos
- LLDB에는 수많은 subcommand와 option이 존재하므로 help와 apropos를 통해 힌트를 받을 수 있다!!
-
Help
해당 문법으로 사용가능한 Subcommand, Option 리스트나 사용법을 보여주는 유용한 명령어
# LLDB에서 제공하는 Command가 궁금하다면, (lldb) help # 특정 Command의 Subcommand나, Option이 궁금하다면, (lldb) help breakpoint (lldb) help breakpoint set -
Apropos
원하는 기능의 명령어가 있는지 관련 키워드를 통해 알아볼 수있는 명령어
  # reference count를 체크할 수 있는 명령어가 있을까? 궁금하다면,
  (lldb) apropos "reference count"
  # 결과
  # The following commands may relate to 'reference count':
  #    refcount -- Inspect the reference count data for a Swift object
BreakPoint
Breakpoint 관련 명령어들
function
- 특정 이름을 가진 모든 함수에 —name option으로 break 걸 수 있음
- 아니면 정규표현식을 사용할 수도 있음
breakpoint set --name viewDidLoad
== b -n viewDidLoad

breakpoint set  --func-regex '^hello'
== rb '^hello'
file
- 파일의 이름과 line 번호를 이용해서 break를 걸 수 있음
# 특정 파일의 20번째 line에서 break
  (lldb) br s --file ViewController.swift --line 20
  (lldb) br s -f ViewController.swift -l 20
Note:💡breakpoint가 걸려 있을 때 녹색 햄버거 버튼을 그래그하면 다음 실행 지점을 변경할 수 있음!!
condition
- break 걸 때 조건을 걸 수 있음
# viewWillAppear 호출시, animated가 true인 경우에만 break
  (lldb) breakpoint set --name "viewWillAppear" --condition animated
  (lldb) br s -n "viewWillAppear" -c animated
command 실행
- -command option으로 break 시 원하는 LLDB command를 실행할 수 있음
(lldb) breakpoint set -n "viewDidLoad" --command "po $arg1" -G1
(lldb) br s -n "viewDidLoad" -C "po $arg1" -G1
auto continue option(-G)
- command 실행 후에 자동으로 break를 풀어주는 옵션!
Note:💡 위의 꺼를 확실히 더 줄여서 breakpoint를 생성할 수 있도록 도와주는 shorthand command!!
특정 이름을 가진 function에서 break
(lldb) b viewDidLoad
현재 파일 20번째 line에서 break
(lldb) b 20
특정 파일 20번째 line에서 break
(lldb) b ViewController.swift:20
현재 파일 내 특정 text를 포함한 line에서 break
(lldb) b /stop here/
특정 주소값에서 break
(lldb) b 0x1234000
</aside>
Break Point 리스트 확인하기
  # breakpoint 목록 전체 출력
  (lldb) breakpoint list
  (lldb) br list
  # breakpoint 목록 간단하게 출력
  (lldb) br list -b
  # 특정 id를 가진 breakpoint의 정보만 출력
  (lldb) br list 1
BreakPoint 삭제 or 비활성화
 # breakpoint 전체 삭제
  (lldb) breakpoint delete
  (lldb) br de
  # 특정 breakpoint 삭제
  (lldb) br de 1
  # breakpoint 전체 비할성화
  (lldb) breakpoint disable
  (lldb) br di
  # 특정 breakpoint 비활성화
  (lldb) br di 1.1
Stepping
- step over
next혹은 줄여서n을 치면 다음으로 넘길 수 있음!!
- step in
- 함수 안으로 가고 싶다면??
step혹은s로 함수 내부 시작지점으로 이동해줌
- 함수 안으로 가고 싶다면??
- step out
- 함수가 리턴될 때까지 진행한 후 break를 걸어주고 시다면
finish를 쓰면 됨!
- 함수가 리턴될 때까지 진행한 후 break를 걸어주고 시다면
Note:💡breakpoint에서 나가고 싶으면 continue를 쓰면 됨
Expression
po
- 우리가 아는 po는 바로
expression -O —의 줄임말임!! po self를 하면 NSObject의 debugDescription이 출력됨- override를 해놓으면 마음대로 커스텀도 가능!
override var debugDescription: String {
    return "이 객체의 debugDescription은 \(super.debugDescription) 입니다."
  }

po self // 이 객체의 어쩌구 저쩌구
variable 사용하기
- expression command로 값을 변경해줄 수도 있음!!!
- LLDB는 내부적으로 local varaible을 $R~형태로 저장하기 때문에 그걸 보고 값을 바꾸면 되는 거지!!
expression self.view // 이걸 출력하면 해당 $R~어쩌구가 뭐가 있는지 다 출력됨
expression $R0.backgroundColor = .blue // 이렇게하면 $R0인 친구의 백그라운드가 blue로 변경됨!
continue
variable 선언하기
- expression command로 변수를 선언할 수도 있음!!
- 단, 변수명에 $를 붙여줘야함!
(lldb) expr let $someNumber = 10 // 하지만 po self하면 보이지는 않지만 해당 변수를 사용하면 사용이 됨!
-ignore-breakpoints option 활용하기
--ignore-breakpoints는 유용한 option중 하나로, expression 실행 중 만나는 breakpoint를 ignore할지 여부를 선택할 수 있습니다. (default 값은 –ignore-breakpoint true 입니다.)
#  실행 도중 breakpoint를 만나도 그냥 진행
(lldb) expression --ignore-breakpoints true --
(lldb) ex -i 1 --
#  실행 도중 breakpoint를 만나면 멈춤
(lldb) expression --ignore-breakpoints false --
(lldb) ex -i 0 --
주소값 이용해서 변수 사용해보기
객체의 주소값과 Type만을 알고있는 경우, 해당 변수의 정보를 알아볼 수 있을까요? 네! Swift의 unsafeBitCast(to:)함수를 이용하면 가능합니다
expr -l swift -- import UIKit // uikit import도 가능!
Image List
image list- 현재 프로세스에서 로드되어 있는 모든 모듈들의 정보를 출력
image dump- 모든 모듈의 구체적인 내용을 뽑을 수 있음
image lookup- 특정 필터링해서 모듈의 내용을 볼 수 있음
# 함수 이름 (--function)
  (lldb) image lookup -F "functionName"
  # 주소값 (--address)
  (lldb) image lookup -a "0x00address"
  # 파일 이름 (--filename)
  (lldb) image lookup -f "FileName.swift"
  # 라인 번호 (--line)
  (lldb) image lookup -f "FileName.swift" -l 15
  # 정규식 이용 (--regex)
  (lldb) image lookup -rn "regexExpression"
크래시난 곳 한번에 찾아보기
크래시 났을 때의 로그 형태 크게 3가지!
안이쁜, 조금 이쁜, 이쁜 형태… 이렇게 구성되어 있음
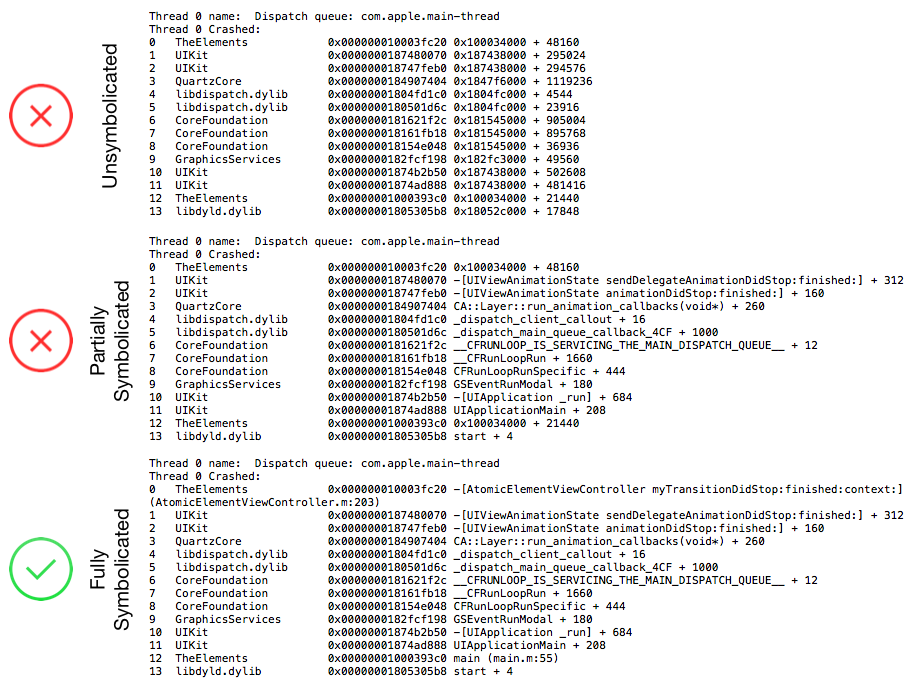
Q. 위에처럼 에러가 나면 어디서 문제가 일어났는지 파악하기 아주 어려운데 어떻게 볼 수 있을까?
A. 가장 상단의 Unsymbolicated Crash Log의 Backtrace를 보면
    0  The Elements  0x000000010003fc20 0x100034000 + 48160 // stack address load address offset
    1  UIKit                    0x0000000187480070 0x187438000 + 295024
    2  UIKit                    0x000000018747feb0 0x187438000 + 294576
    ...
– Binary Image Name : The Elements 는 Crash가 발생한 Main Application 실행 파일입니다.
– Stack Address : 해당 Symbol의 Stack 메모리 내 주소값을 의미하며, 위 trace에서는 0x000000010003fc20에 해당합니다.
– Load Address : Application이 Load되어있는 주소값을 의미하며, 위 trace에서는 0x100034000 에 해당합니다.
– Offset: 48160는 StackAddress와 LoadAddress 사이의 Offset을 의미합니다.
( == StackAddress – LoadAddress )
symbol address = slide + stack address - load address
               = slide + offset
# slide value는 32bit architecture의 경우  0x4000, 64bit architecture의 경우  0x100000000를 가집니다.

=> symbol address = 0x100000000 + BC20 = 0x10000BC20 # 참고: 48160 (10진수) == BC20 (16진수)
- 0x10000BC20 이 문제의 지점!!!! 🤬
- Terminal을 열고
$ lldb를 통해 LLDB Console을 엶 (lldb) target create "dSYM 경로”으로 dSYM file에 attach(lldb) image lookup --address 0x10000bc20symbol 위치 검색해주면 어디서 일어났는지 알 수 있음!!
cf. 자주쓰는 명령어가 있다면 ~/.lldbinit 파일에 원하는 command alias 별명 "줄이고 싶은 Command” 을 넣어서 쓰면 됨!
cf. 좀 더 LLDB를 잘쓰게 해주는 툴: Derek Selander, Chisel